
| A study,
analysis, whatever of the Wharfedale SFB3 came to mind in early 2018 and
I finally got a round tuit,
with that which I have at my disposal, probably much more than the average hobbyist but a far cry from an acoustical laboratory. To encourage the reader (you) to read on, I have to say that to my ears, the sound far exceeded my expectations and I will admit, my preconceived notions. In all fairness, I will also admit that I may have pushed these things beyond their design parameters and that resulted in deviating from the original to adding a first order passive network, which is two-fold. One: To protect the ten inch from being driven beyond its excursion limits. Since this unit and the twelve are originally wired in parallel with close to equal impedance, the power delivered would be split between the two. However, the lighter cone & coil of the ten would allow it to move easier, thus stretching the annulus and spider. Two: When new, the cones, especially that of the twelve would very likely be spongier than it is now, some fifty years later; it seems to be dry and somewhat brittle, allowing it to transmit traverse waves as well as being more susceptible to cone breakup. The end result was a peak in the band between 1khz and 2.3khz of the order of 5dB (avg). The ten exhibited a similar but narrower peak between 1.5khz and 2khz and of lesser amplitude. Disconnecting the ten made no difference in this perceived sharpness; the main difference being a slight lowering of the SPL of the system, about 2dB. A 31 band graphic eq made short order of that so a passive filter was considered. After a little trial and error, a 4mh inductor in series with the twelve alleviated that problem. The peak in the ten was reduced with a series inductor of 2mh. (See Fig.8) The same logic was applied to the twelve. (See Figs. 7 & 8) It is suggested that if the system sounds bright to anyone, a graphic equalizer is recommended; a ten band will do the trick. A parametric is better but more expensive and a little more difficult to set up. This also has the advantage of being altered for different music. There are some like the Behringer DEQ2496 that have a 31 band graphic eq, a ten band parametric and 64 memories in which various setups can be stored. The unit has many other features and sells for about $300. I have one and love it when I play music from the 60's and earlier. |
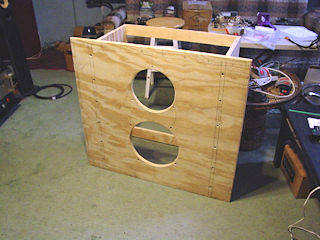
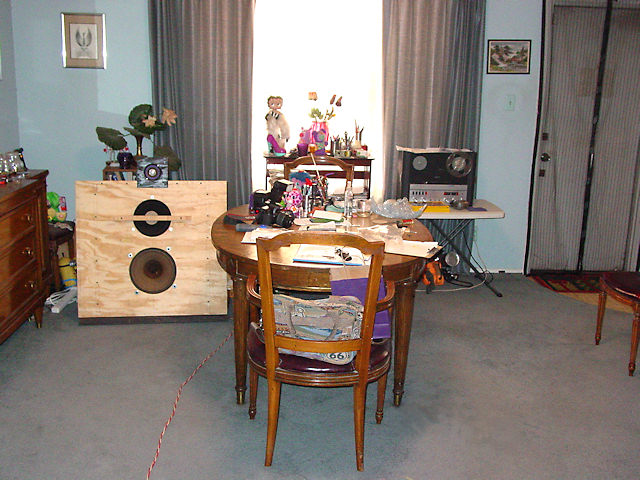
| Photo 1 | Photo 2 |
 |
 |
| Photo
3
The upward firing Super 3 doesn't work as intended. See Figure 12 It does a better job in the corner Wharfies but they have the advantage of being closer to the ceiling, in a corner and the rear radiates into free space as does the front while the rear of this radiates into the box. One of those cabinets can be seen here about midway into the page |
 |
| Photo
4
Another will be built and placed on the right. Since I don't have another W12FS, I'll use two of the 4 remaining W15FS and CS units that are lying around doing nothing like Willie Nelson's Guitar In The Corner. |
 |
| Photo
5
The device in front of the ten is a phase plug intended only to disperse the frequencies around 2355hz. The result wasn't as expected as the plug is too far from the cone. This led to the filters (crossover) |
 |
Photo 6: The graphic eq was used to locate and trim the sharpness in the octave between 2khz and 4khz.
The bass boost was used for another set of speakers and not noticed but is probably the cause of overdriving the tens at SPLs approaching 95dB.
The attenuation in the higher bands virtually eliminated the harshness at any level, even levels close to 100dB.
I'll tell ya, y'ain't heard Rock-a-Billy 'till ya heard it LOUD.
The two (there's a third above them) parametrics are NADY PEQ-5B units. These two are set for a pair of 6 cubic feet Wharfedale corner reflexes and they're adjusted to give me that juke box sound I heard as a teenager. I LOVE DOO-WOP. Buddy Holly, Chuck Berry, Carl Perkins, Eddie Cochran, Del-Vikings, the Diamonds and the King of Rock 'n Roll. Then came the 60's with the female groups like the Ronettes and the Crystals. The list is endless. What an era and I was a teenager right in the midst of it.

| Photo
7
The rear is about 4 feet from the rear and side walls. Ignore the Minions, they're just snooping around the crossover components. |
 |
Figure 1
Two system impedance curves, the green being that of the W12FS, the SFB10 and the Super 3;
the lighter pink being that of the SFB10 only and the darker pink being that of the W12FS
The SFB10 has an unusual impedance curve. (See text above fig 3)

Figure 2
Green curve is same as above, W12FS, SFB10 and Super 3.
The brown curve is that of the system with the SFB10 replaced with the CSB. This is due to the high impedance of the CSB at 32hz.(see #12 fig.3)

Figure 3
The J1(10"SFB) unit (light cyan) has a slightly lower fs than the J2 (10"SFB) (dark cyan)
The purple curve is the impedance of both wired in parallel (8 ohms) The evenness of the hump is attributed to the shift in fs between the two.
The asymmetrical resonance peaks may be due to the compliance of the moving system, in versus out. This is usually noticed visually with a cupped or domed spider although such has not been seen here; the spider appears flat. It was found to be the annulus which was angled down, which I recall when I applied the felt annuli in June 2017. That process is documented here. SFB/10 Since the spiders were flat, not cupped, it was suspected that part of the cone circumference had been cut during a previous repair. However, one of these two SFB10s had what appeared to be a complete cone although different from the W10FSB (Foam Surround, Bronze basket) but the baskets are identical. This W10FS is all original and does not have a drooping cone, despite being upward firing for decades. The foam, however, is more compliant than the felt and the W10FSB was not intended for use as a woofer.
The SFB/10 and W10FSB are links to their respective pages.
The red curve (#7) is typical for a sealed or open enclosure; a vented enclosure will have two peaks. The 12 inch unit has a very similar impedance curve with the fs being at 25hz. (See curve 7, fig.1)
The annuli will have to be replaced; one of the pair of SFB tens is in that process. It will be replaced with a flat foam annulus like that of the W12FS here. the resultant impedance curve will look similar to that of the 10CSB, curve 12.
The SFB10-J2 now has a new annulus - foam. (Oct. 4, '18) See fig.3B (next)
These SFB10's have overhung voice coils. There are two layers, the inner having 73 turns of wire and the outer having 71 turns for a total of 144 turns. The length of the coil windings is 13/32 inch, 0.46025 inch, 10.32mm.
The DC resistance of the coil in the 10SFB-J2 is 17.21 ohms and that of the SFB10-J1 is 16.75 ohms. The unit currently in this SFB3 is the J1.

Figure 3B
The new impedance curves, brown & blue, now symmetrical. Fs (J1) 76hz; fs (J2) 73hz

Figure 3C
This pair of curves compares the impedance of the system with the re-foamed SFB10 (black) vs the cloth annulus. (green)
This curve is all over the place and I'm not about to attempt an explanation except that the dips at 5khz and 7khz are due to the 4uf or 2uf capacitors, respectively..
The only filter component is either system is the 4uf capacitor for the tweeter. The difference in the impedance above 1khz is most likely due to the change in impedance of the 10" unit in that range which, in turn, is due to the compliance of the annulus and the more symmetrical motion above and below the rest point of the cone & coil. The inward (down) motion was very restricted with the cloth annulus which was drooping down due to the position of the cone's circumference being below the baskets' rim to which the annulus is attached, despite the spider's being flat, not cupped. See figs 3D & 3E next.

Figure 3D and 3E
| The two drawings below are for clarification, if needed, between the drooping (right) and flat (left) annuli at A. The turquoise, blue-green, green blue, wharever, L shaped areas are supposed to represent the outer ring of the basket. It can now more easily be seen why the cone assembly can't move down as much as up. This will cause non-linear distortion and can account for the asymmetrical appearance of the impedance curve, (see fig.3B (pink) | |
 |
 |
Figure 4
Near Field (NF) responses at 0.125" from cone apex. The black (J1) has a lower fs than the purple (J2) speaker (See 9 & 10, fig 3)

DINING ROOM
This room, actually two, a living room and dining room separated by a 5 feet wide wall and a 12 feet wide archway.
The two combined measure about 17ft by 36ft.
It must be noted that the following response curves were all run continuously, no gating, hence the room acoustics affect the result. The mic was arbitrarily positioned at 11 feet, on axis and at ear level when standing, placing it about 61 inches above the floor. Also, these curves are for comparative purposes, used only during the crossover design and are in very little manner resemblant of the actual response of the system.
Figure 5
Responses of each unit by themselves, in the SFB3 baffle. They were measured as described above. Note the overlap of all three in the region between about 2600hz and 4000hz and the wider overlap between the ten and tweeter. (black & blue curves) This was addressed after an audition which also led to the crossover. This is explained in more detail in fig. 12.

Figure 6
Showing the response difference of the SFB10 with (purple) and without (black) the series 68uf capacitor.
The knee, -3dB point would be around 160hz.
This curve, like the others is influenced by the room acoustics, hence the large peaks and dips below 250hz.

Figure 7
This pair of curves shows the effect of the W12FS with (green) and without (red) the 4mh series inductor.
Here, the knee would be around 700hz.

Figure 8
Responses of the combined W12FS and SFB10 with (blue) and without (black) the filters, which are shown in fig.13.
The tweeter is not in the circuit, hence the roll-off after 5khz.

Figure 9
Removed due to duplication. Space left here so as not to have to re-number the rest and the references to them.
Figure 10
Frequency Responses - comparison with and without crossover.
Curve 50, red, is that of the original configuration with only the 4uf capacitor for the tweeter. Curve 54, brown, is with the crossover.
It does render a mellower tone but not muffled, most noticeable at levels above 85dB.

Figure 11
The red curve's labeling as G55-G56 is the result of subtracting the cable impedance which was high due to its 40 feet length. Its impedance hovered around 0.75 ohms.
The red curve includes the crossover (fig.13)
The green curve is that of the original 3 speakers with only the 4uf capacitor in the tweeter line for comparison.
The effect of the filters is evident at 250hz and 7khz.

Figure 12
Two curves showing the difference with the tweeter firing up (green) vs forward (brown). The forward firing tweeter does seem a little harsh in its lower passband (2.8khz and lower) despite the high pass filter. The knee (-3dB) is around 2.8khz and attenuates at 6dB/octave from there, being about -9dB at 1200hz. It is suggested that a 2uf capacitor be used as this will place the knee at about 5.6khz and be -9dB at 2.8khz, 6dB below that of the 4uf capacitor. To my ears, it sounds a lot less abrasive. It has no effect on the high frequency response above 5khz. Keep in mind, that the louder output of the tweeter with the 4uf cap vs that of the 2uf cap, is a psycho-acoustic effect. It's much the same as the perceived drop in high frequencies when using Dolby® on tape. Many claimed that the Dolby® reduced the highs but a properly set up Dolby® processor has no such effect; it attenuates the tape hiss by as much as 14dB and that subtle hiss creates the illusion of extra high frequency response. Again, psycho-acoustics, that phenomenon created by the grey matter between the ears.
It seems worthy of comment whilst on the subject of psycho-acoustics that this same phenomenon rears its head regarding bass from a neodymium magnet woofer vs one with an Alnico or ceramic magnet. The reason is that the stronger field produced by the neo dampens the cone and coil better in that it more accurately follows the electrical signal applied to the coil. The weaker field will allow the cone to lag behind the signal due to its moment of inertia and keep on moving when the signal reverses, due to momentum. We've become so accustomed to the distortions present in our music systems that we consider the removal of those distortions as negative.
Consider an aircraft carrier. It's huge mass impedes acceleration but once moving along at about 20 knots, it can take several miles to stop it with the engines in full reverse. Inertia and momentum.

Figure 13
This set of curves probably says it all, including the need for the filters in the twelve's and ten's circuits; i.e. the necessity of the crossover is preferential.
For clarification, the black curve is the original Briggs' configuration with only the tweeter's 4uf capacitor. That curve was measured at 11 feet and a mic height of 61 inches (listener standing). Curve 51, red, measured at the same distance and height but with the crossover. The effect of the crossover is apparent.
The blue curve, #67 is that of the original Briggs' configuration but now measured at about 11 feet and a mic height of 34 inches. This height and distance closely simulates the height of a seated listener's ears. The green curve, #66 is measured from the same location as #67 but with the crossover.
The 6dB rise in the band between 800hz and 1500hz, centered at 1khz may not be objectionable at moderate listening levels (80dB). This would, of course, depend on the type of music as a female voice may sound a little harsh. However, brass instruments may sound great. Again, it's so damned subjective.

Table 1
SPL using pink noise (no crossover except for the 4uf cap in the tweeter.
Voltages measured on a computer based scope, PicoScope 2205A
| V(peak) | V(rms) | Power (W) | SPL@ 11ft | The mic
location was arbitrarily chosen but is still on axis. Had two
systems been available, the mic would be equidistant from each and most
likely at the same distance.
Last 4 in table are extrapolated. Normalizing the SPL at 1w/11ft to 1w/1m we get 88 dB |
| 1.6 | 1.12 | 0.16 | 70 | |
| 4.0 | 2.83 | 1 | 78 | |
| 6.0 | 4.24 | 2 | 81 | |
| 8.0 | 5.66 | 4 | 84 | |
| 11.3 | 7.99 | 8 | 87 | |
| 16 | 90 | |||
| 32 | 93 | |||
| 64 | 96 | |||
| 128 | 99 | |||
Figure 13

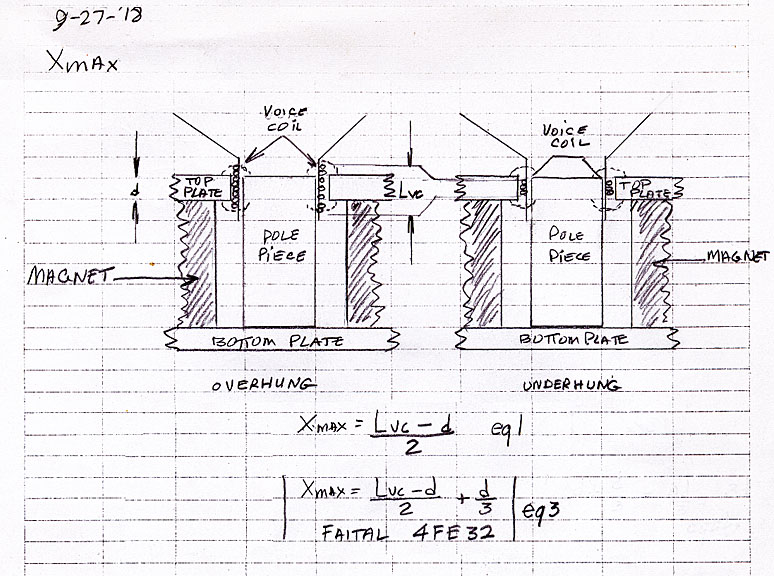
Figure 14
Drawing showing the difference between an overhung and an underhung voice coil.
The equations show how Xmax is determined.
In Englysshe, it's half the difference between the voice coil length (Lvc) and the thickness of the top plate (d)
However, the magnetic field doesn't stop at the top of the gap; it follows a dome shape slightly above the gap as shown by the dotted lines above and below the gaps. This seems to be what has been taken into account by Faital in Italy (eq. 3) By that eq., is appears that the useful field above the gap is about one third the thickness of the top plate. I would suspect that non linear distortion is taken into account as this will rise as the coil exits the field. This brings up a speaker spec called the BL product, which is the product of the field strength in Teslas (T) and the length (L) of the wire in the field. It's stated as Tesla/meters (Tm). Actually, the force (F) applied to the coil is BLI, where I is the current. It's synonymous with Newton's law that states F=ma, where m is the mass and a is the acceleration. From that, we get F=ma=Bli and therefore, the useful relationship between ma and Bli. Engineers have a heyday with such mathematical relationships as did I but these relationships say nothing about how the speaker sounds1.
Another tidbit on magnets. The strength of an Alnico magnet by itself as used in speakers is about 1 Tesla while that of a neodymium magnet can be as high as 1.5T. This changes when a gap is introduces as the narrower the gap, the stronger the field within. Ribbon coils, which resemble a Slinky spring maximize the length of the wire in the field and allow for a narrower gap, both which will increase the Bl product, the result being a higher force. It's quite a juggling act.
The ribbon was first introduced in the dirty thirties by one James B. Lansing. He rolled round copper wire between a pair of rubberless washing machine rollers (wringers) to flatten the wire.
NOTE: There was an eq.2 but it was found to be in error and thus, was removed.
1. SOUND. The sensation produced by stimulation of the organs of hearing by vibrations transmitted through the air or other medium.
OOOOOO KAY. This brings up an interesting question, which asks, "If a tree falls in the forest and no one it there to hear it, does it make a sound?"
Most would say "YES". However, based on the definition of sound, the correct answer would be NO. Since no one is present, there are no 'organs of hearing', ergo, no sound. The pressure wave (vibration) is still present and although a microphone will pick it up, the mic has no ears. (organs of hearing) Therefore, no sound is produced.
This brings up another similar subject, COLOR. What is it? Does it actually exist? Consider what it really is; an electromagnetic wave of a certain band of frequencies. No different than any other electromagnetic wave other than its frequency. A very small band of these frequencies activate the optic nerve which the brain perceives as color. Therefore, color exists only because we do. Red, by itself, as any other color, doesn't exist.
So, since sound and color exist only because we do, the same can be asked about that which we call reality. But, let's not go there.
Back to the loudspeaker main page
